IELTS Bar Graph

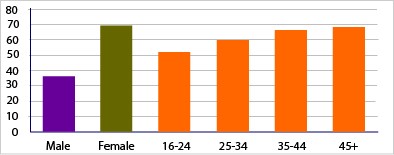
Men and women attending evening courses at an adult education centre

IELTS Academic Writing Task 1 with answer. You should spend about 20 minutes on this task. The bar chart below shows the numbers of men and women attending various evening courses at an adult education centre in the year 2009.…

Average monthly temperatures and rainfall in Kolkata

IELTS Academic Writing Task 1 with answer. You should spend about 20 minutes on this task. The climograph below shows average monthly temperatures and rainfall in the city of Kolkata. Summarize the information by selecting and reporting the main features,…

Global sales of different types of digital games between 2000 and 2006

IELTS Academic Writing Task 1 with answer. You should spend about 20 minutes on this task. The bar graph shows the global sales (in billions of dollars) of different types of digital games between 2000 and 2006. Summarize the information…

Global sales of the top five mobile phone brands

IELTS Academic Writing Task 1 with answer. You should spend about 20 minutes on this task. The chart below shows global sales of the top five mobile phone brands between 2009 and 2013. Summarize the information by selecting and reporting…

The fertility rate of women in six Gulf countries

IELTS Academic Writing Task 1 with answer. You should spend about 20 minutes on this task. The graph below shows the fertility rate of women in six Gulf countries. Write a report describing the information in the graph below. You…

Average hours of unpaid work per week done by people in different categories

IELTS Academic Writing Task 1 with answer. You should spend about 20 minutes on this task. The diagram below shows the average hours of unpaid work per week done by people in different categories. (Unpaid work refers to such activities…

Computer and internet per 1000 users in Arab world

IELTS Academic Writing Task 1 with answer. You should spend about 20 minutes on this task. The chart shows the computer and internet per 1000 users in Arab world. Write a report describing the information in the graph below. You…

Expenditure in Million Pounds on fast food items by income groups

IELTS Academic Writing Task 1 with answer. You should spend about 20 minutes on this task. The Bar graph bellow shows the Expenditure in Million Pounds on fast food items by income groups in UK. Write a report for a…

Female unemployment rates in each country of the United Kingdom

IELTS Academic Writing Task 1 with answer. You should spend about 20 minutes on this task. The graph below shows female unemployment rates in each country of the United Kingdom in 2013 and 2014. Summarise the information by selecting and…

TV programmes watched by men and women in Australia

IELTS-writing-task-1:Percentage who watch reality shows

IELTS Academic Writing Task 1 with answer. You should spend about 20 minutes on this task. The charts give information about two genres of TV programmes watched by men and women and four different age groups in Australia. Summarise the…