IELTS Academic Writing Task 1 with answer.
You should spend about 20 minutes on this task.
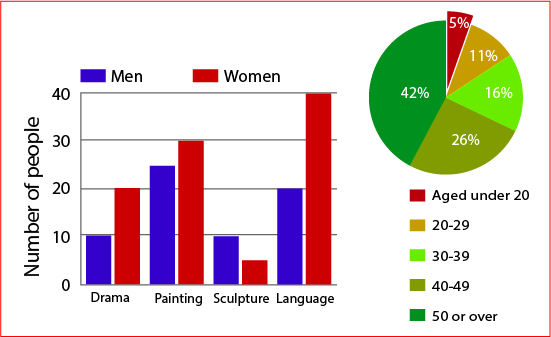
The bar chart below shows the numbers of men and women attending various evening courses at an adult education centre in the year 2009. The pie chart gives information about the ages of these course participants.
Summarize the information by selecting and reporting the main features, and make comparisons where relevant.
You should write at least 150 words.
Sample Answer:
The given graphs present information on the participants on the adult education and their age groups in the year 2009. Overall, numbers of male students were more than their female counterpart and people who were 50 years old or over were more than 40% of the total participant in this adult education centre.
According to the bar graph, 20 male students attended drama classed in the adult education centre while 10 female attended in this same course. In painting number of male students was 30 compared to the approximately 24 female students. Least number of students attended sculpture related education where female exceeded the male students (female about 10 while make only about 5). Highest number of students went to language course where male students (40 participants) were double than the female (20 participants) students.
The supplied pie chart shows the percentage of students based on their age groups. As is observed from this graph, people over 50 or above comprised more than 42% of the total participants. Second largest participants who joined the adult education courses came from 40 to 49 years age group while all other participants of other age groups comprised the remaining 32%.

