In Academic IELTS writing task 1, you might expect to have one of the following graph types:
9 types of IELTS Graphs:
- IELTS Bar Graph.
- IELTS Line Graph.
- IELTS Pie Chart.
- IELTS Table Graph.
- IELTS Diagram.
- IELTS Map.
- IELTS Pictorial.
- IELTS Flow Chart.
- IELTS Mix Graph.
If you are taking the Academic IELTS, in your writing task 1 you will need to describe a graph. The graphs come with various data and you need to write at least 150 words in this task. Your ability to describe the information present in the graph accurately and precision in writing style would determine your score.
Ideally, you should spend about 20 minutes on this task and that would allow you to use the remaining 40 minutes on essay writing.
It is advised that you write the summary of the data presented in the graph. Your graph writing question would include:
“Summarise the information by selecting and reporting the main features, and make comparisons where relevant.”
It is clear from the question that you are expected to write the summary of the graph, and present the main features of the graph. Comparing and contrasting are also expected. However, never try to describe every piece of data.
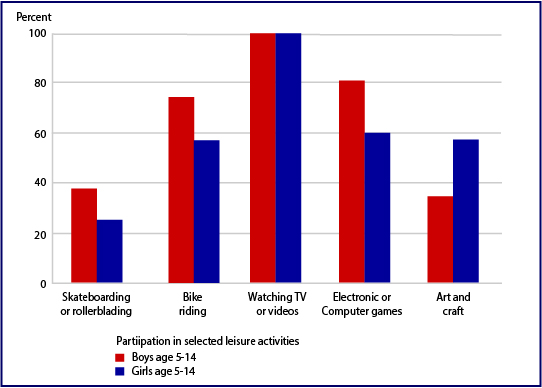
IELTS Bar Graph
A bar graph would be present in the question and you would need to describe the main features of the bar graph. It is also recommended that you present the summary of the bar graph as well as make a comparison where relevant.
Example of a Bar Graph:
Click here to get the list of the IELTS Bar Graph with model answers.
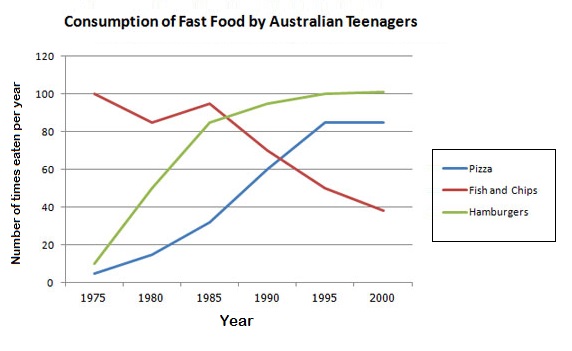
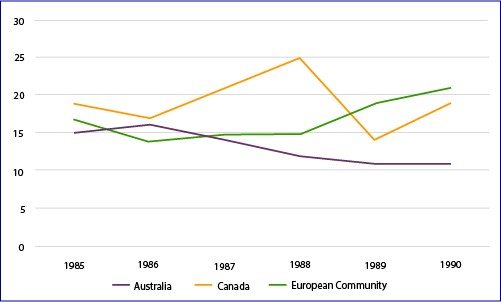
IELTS Line Graph
The data presented on a Line graph are usually easier to describe. However, that might get complex if there are a larger number of data to compare.
Example of Line Graph:
Click here to get the list of the IELTS Line Graph with model answers.
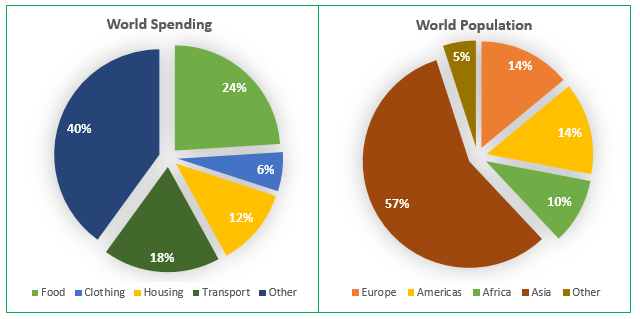
IELTS Pie Chart
The pie chart shows the comparison and segments of data and is often given in the IELTS academic task 1. You should easily be able to describe the pie chart and its data once you are acquainted with the process of describing pie charts.
Example of Pie Chart:

Click here to get the list of the IELTS Pie Chart with model answers.
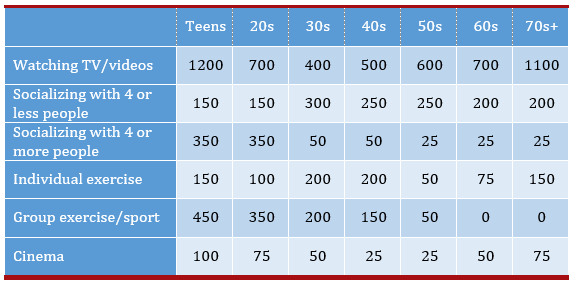
IELTS Table Graph
Table graph presents data in a table and there are usually multiple columns and rows of data. Comparing data presented on the table should also be practised to efficiently present the data in your writing.
Example of Table Graph:
Click here to get the list of the IELTS Table Graph with model answers.
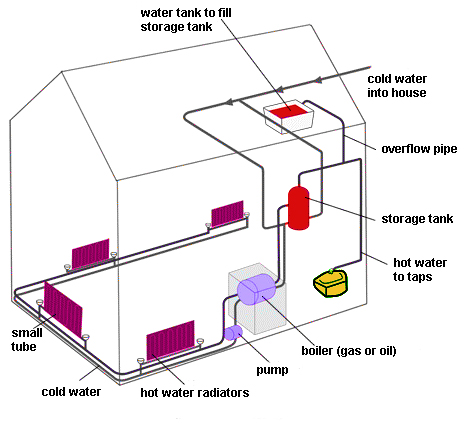
IELTS Diagram
Diagrams often present how a process works or how something works. It might be from a simple range to a very difficult one. Before you start writing the answer always pay attention to understanding the diagram first.
Example of Diagram:
Click here to get the list of the IELTS Diagram with model answers.
IELTS Map
This type of graph often presents two maps of a place and asks the candidates to compare the changes. This could be a single map as well.
Example of Map:
Click here to get the list of the IELTS Map with model answers.
IELTS Pictorial
Pictorials are quite similar to diagrams and maps and often present the picture of a place of thing. This is kind of pictorial form of data.
Example of Pictorial:

Click here to get the list of the IELTS Pictorial with model answers.
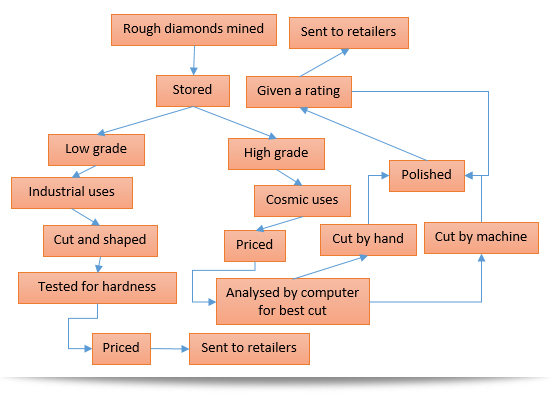
IELTS Flow Chart
The flow chart shows the flows of a processes or steps. You should always spend few times on understanding the flow chart before describing it.
Example of Flow Chart:
Click here to get the list of the IELTS Flow Chart with model answers.
IELTS Mixed Graph
In your Academic IELTS task 1, you will often find more than one graph of various types. For example, a graph question that would present data using a table and then a pie chart and so on. You should be able to present data accurately even if there are multiple graph types.
Example of a Mixed graph:
Click here to get the list of the IELTS Mixed Graph with model answers.