IELTS Academic Writing Task 1 with answer.
You should spend about 20 minutes on this task.
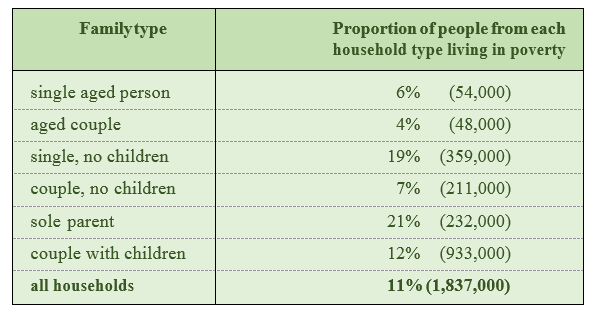
The table below shows the proportion of different categories of families living in poverty in Australia in 1999.
Summarise the information by selecting and reporting the main features,
and make comparisons where relevant.
You should write at least 150 words.
Sample Answer:
The given information of the table data shows the Australian poor family types and compare these families diving in 6 categories.
As is observed from the table data, 11% of total Australian families were living in poverty in 1999.
As is observed from the given data, total number of poor family in Australia was over 180 thousand in 1999 and this number was 11% of the total Australian families. Highest percentage of this poverty stricken families were sole parent type family that comprises 21% of the total population. Couple who had children comprised 12% poor family while this percentage for single person without children was 19%. Poverty among family types ‘single aged person, aged couple, and couple without children were comparatively less and their percentages were around 4 to 7%.
In summary, 11% families in Australia in 1999 were poor and single persons and parents with children had more economic problems than that of single, aged couple and childless parents.

