IELTS Academic Writing Task 1 with answer.
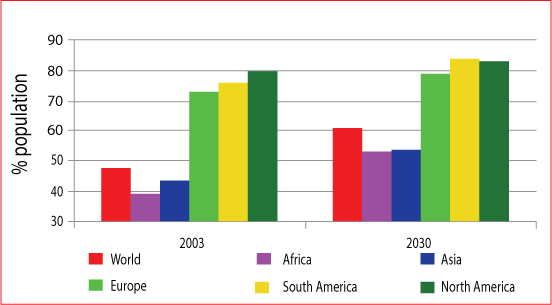
The bar graph below shows percentage of population living in urban areas in 2003 and 2030 (estimated).
Summarise the information by selecting and reporting the main features, and make comparisons where relevant.
You should spend about 20 minutes on this task.
You should write at least 150 words.
Percentage of population living in urban areas in 2003 and 2030 (estimated)
IELTS Academic Writing Task 1: Sample Answer
The bar graph presented compares the urban area population in five continents in 2003 and also gives prediction for the year 2030. As is seen in the graph, American and European countries had far more percentages of urban population in 2003 than that of African and Asian countries and in 2030 more people will live in urban areas that they did in 2003.
According to the bar graph 70% to 80% population in North America, South America and Europe lived in urban areas in the year 2003. Far less percentage of urban population percentages could be observed in Asia (about 43%) and Africa (less than 40%). In this year the percentage of urban dwelling people was about 48% world-wide.
The prediction of the graph estimates that the city dwellers world-wide in 2030 will be just above 60%. In this year the city living populations’ percentage in Asian and African countries will be above 50% while more than 80% people in American continent will live in urban areas. Just below 80% population in Europe will live in different cities in 2030.

