IELTS Academic Writing Task 1 with answer.
You should spend about 20 minutes on this task.
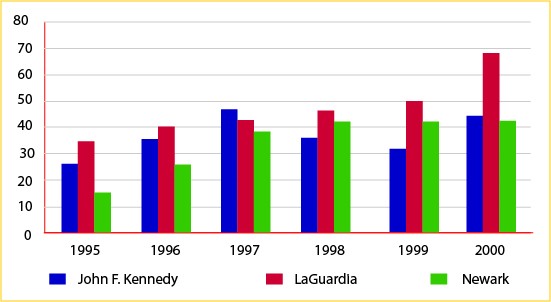
The chart below shows the number of travellers using three major airports in New York City between 1995 and 2000.
Summarise the information by selecting and reporting the main features, and make comparisons where relevant.
You should write at least 150 words.
Airport visitors, 1995-2000 (millions of passengers per year)
Sample Answer:
The supplied graph gives information on the New York airport travelers for a 5 years’ time starting from 1995 to 2000. As is observed from the bar graph, total air travelers increased in number over time and LaGuardia was one of the most popular airports in New York.
According to the given data, initially in 1995 more than 25 million people used John F. Kennedy airport while 35 million people used the LaGuardia airport and this airport had the largest number of travelers in this year. Newark air in this year got about 15 million passengers and this was the least among the given three airport commuter numbers. After 1 year, the passenger numbers in all the three airports increased and their popularity and passenger number trends remained almost same as it was previous year. John F. Kennedy airport got the highest number of passengers in 1997 while LaGuardia managed to receive the highest number of air passengers for the nest 3 years.
The number of commuter in LaGuardia and Newark steadily increased over year while this number showed some fluctuations in John F. Kennedy airport. Finally in 2000, the overall air passenger increased and LaGuardia had the maximum number of (about 70 million) air travelers compared to the approximately 40-44 million air passengers in two other air ports.

