IELTS Academic Writing Task 1 with answer.
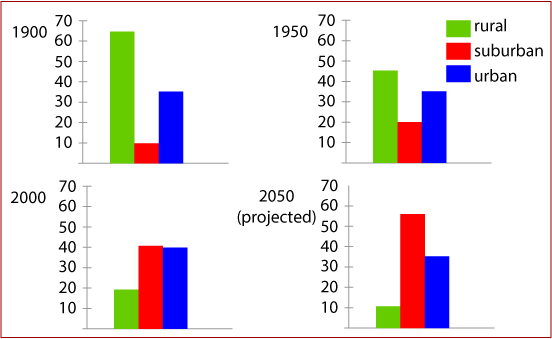
The graphs below show the figures for population distribution in the Northwest for 1900-2050.
Summarize the information by selecting and reporting the main features, and make comparisons where relevant.
You should spend about 20 minutes on this task.
You should write at least 150 words.
Population distribution in the Northwest Region (in %)
IELTS Academic Writing Task 1: Sample Answer
The presented bar graphs compare the population distribution in the Northwest region for three different years with a 50 years’ gap and also gives projection for the year 2050.
As is seen in the given illustration, more people used to live in the rural part in the Northwest but over time suburban and urban area will have much more population than the rural areas.
Initially in 1900, about 65% population lived in rural areas compared to only 10% in suburban and about 25% in cities. It is clear that the population in urban areas alone was higher than the combined population in suburban and urban areas. After 50 years many people migrated to suburban and urban areas and the population distribution in this year shows that rural population percentage decreased to about 45% while population in urban area was about 35%. The suburban population in this year was 20% which was double than the percentage of suburban population in 1900. In the year 2000, suburban and urban population reached to 80% while only 20% people lived in villages.
Finally the projection shows that population distribution in villages will further decrease and will reach to only 10% while highest percentage of population will live in suburban areas (about 55%) and rest of the population 35%) will choose cities as their living place.