IELTS Academic Writing Task 1 with answer.
You should spend about 20 minutes on this task.
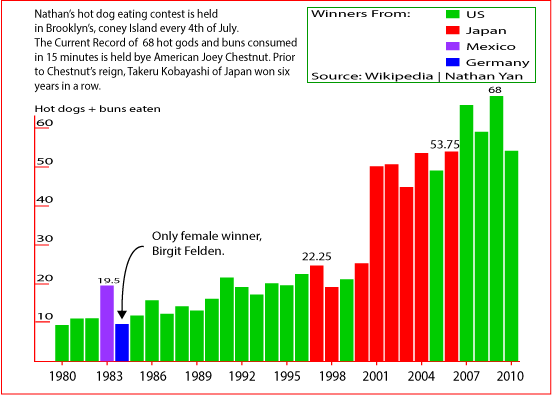
The bar graph bellow shows Nathan’s hot dog eating contest.
Summarize the information by selecting and reporting the main features, and make comparisons where relevant.
You should write at least 150 words.
Sample Answer:
The provided bar chart gives information on the Nathan’s hot dog and bun eating content for 11 years time and also shows the winners from four different countries namely US, Japan, Mexico and Germany. Overall, the number of hot dogs and buns eaten for winning the contest increased over time and US participants won the competition more times than competitors from other countries.
As is given in the illustration Nathan’s hot dog eating competition is help on 4th July every year in Brooklyn’s. The data was taken from the Wikipedia and it reveals that this competition started in 1980. Initially about 10 hot dogs and buns eating record was won by US competitor and in 1983 this record went to a Mexican participant, which was about 19.5 hot dogs and buns. After 1983 till 1996 this record was for US people with average 20 hot dogs and buns consumption. Japanese participant Takeru Kobayashi held this record for six years with average 50-55 hot dogs and buns. For the final 4 years this competition was won by US competitors and among them Joel Chestnut made the record of eating highest (68 hot dogs and buns just in 15 minutes) in 2009. Only female winner in this competition was from Germany and her name was Birgit Felden who ate about 10 hot dogs and buns in 1984 to win this competition.