IELTS Academic Writing Task 1 with answer.
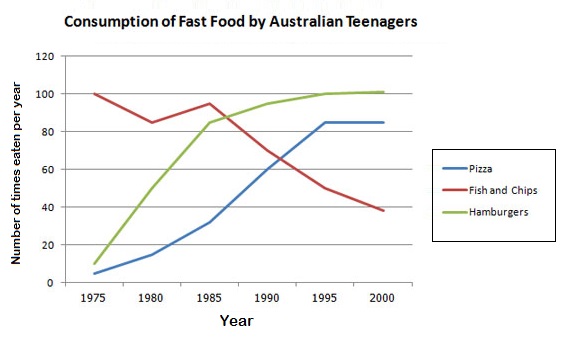
The line graph below shows changes in the amount and type of fast food consumed by Australian teenagers from 1975 to 2000.
Summarize the information by selecting and reporting the main features, and make comparisons where relevant.
You should spend about 20 minutes on this task.
You should write at least 150 words.
IELTS Academic Writing Task 1: Sample Answer
The supplied line graph illustrates the changes in fast food intakes by Australian teenagers from the year 1975 to 2000. Three items of fast food intake is presented in the diagram and it shows that hamburger became the most popular fast food item among Australian teenagers in later years while fish & chips lost its popularity over the time.
According to the given diagram, fish & chips was the most popular fast food item among teens in Australia in 1975. This item was consumed 100 times in year by a teenager while on an average a teenager ate pizza and hamburger around 10 times only. After that, the consumption of hamburger and pizza kept on increasing and reached to over 60 times a year in 1990 and at that time average consumption of fish & chips decreased to around 60 times a year. In the next 10 years the popularity of fish & chips kept on decreasing and less than 40 times intake could be observed in the year 2000 while the consumption of pizza was over 80 times and hamburger 100 times in this year.