IELTS Academic Writing Task 1 with answer.
You should spend about 20 minutes on this task.
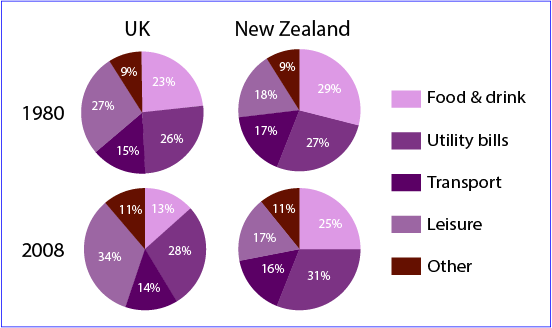
The charts below show household spending patterns in two countries between 1980 and 2008.
Summarize the information by selecting and reporting the main features, and make comparisons where relevant.
You should write at least 150 words.
Sample Answer:
The given illustration presents information on the household expenditure in the UK and New Zealand in five different household categories in two different years namely 1980 and 2008. As is observer from the graph, people of New Zealand spent more on Food & drinks and utility bills while spending made by UK people in leisure activities was much higher than that of New Zealand.
According to the pie chart, the household expenditure were categorized in 5 main sectors: food & drink, utility bills, transport, leisure and other. It is clear from the first pie chart that, the highest amount spent by UK people was in leisure activities which comprises 27% of total household cost. The second most expenditure were made for paying utility bills (26%) while food & drink cost them 23%. The least amount spent by UK people in this year was in transport which was only 15%. All other household expenditure combined to 9% of their expenses. Again in the year 2008, the leisure activity cost them largest percentage (34%) which was about 7% more than they did in 1980. The household expenditure by UK people in utility bills increased by 2%, while the transport expenses decreased by only 1% than that of 1980. A significant decrease was in food and drinks which was only 13% compared to the 23% in 1980.
On the contrary, citizens of New Zealand spent 29% in food and drinks which was the highest percentage in 1980. They spent 27% for paying utility bills, 17% for transport and only 18% in leisure activities. The amount spent by New Zealand people on leisure activities were much less than the amount spent in this sector by UK people. All other expenses combined to remaining 9% in this year which was exactly same as it was for UK. After 28 years, in 2008, utility bills expenses (31%) was the largest expenditure in New Zealand. Amount spent on transport, leisure activities and others were 16%, 17% and 11% respectively.