IELTS Academic Writing Task 1 with answer.
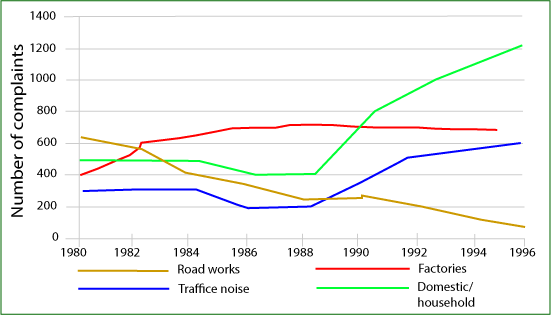
The graph below shows the number of complaints made about noise to Environmental Health authorities in the city of Newtown between 1980 and 1996.
Summarize the information by selecting and reporting the main features, and make comparisons where relevant.
You should spend about 20 minutes on this task.
You should write at least 150 words.
IELTS Academic Writing Task 1: Sample Answer
The given line graph illustrates the number of complaints made to Environmental Health authorities about excessive noise between 1980 and 1996 in Newtown city. As is presented in the given diagram, complaints about road works noise decreased over the time while the number of noise related complaints regarding domestic noises increased.
As is given in the line graph, the number of noise related complaints in the city of Newtown was about 18 to 19 hundreds in 1980 and among them road words noise complaints was highest (more than 600). Domestic noise complaints were in second highest with about 500 total complaints. Traffic related noise complaints were the least in number in this year. The number of complaints related to noise shows many fluctuations over the year and in 1987, the number of complaints decreased except for the factories related complaints. After 1990, the number of complaints kept on increasing except for road works related complaints and in 1991 the number of total complaints was more than 2200. Finally in 1996 the total number of noise related complaints rose and reached to around 2600 and more than 1200 complaints were related to domestic issues.