IELTS Academic Writing Task 1 with answer.
You should spend about 20 minutes on this task.
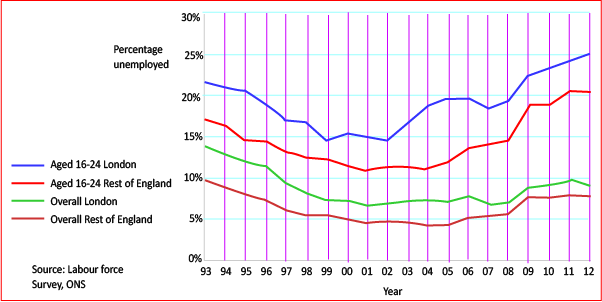
The graph below shows changes in young adult unemployment rates in England between 1993 and 2012.
Summarize the information by selecting and reporting the main features, and make comparisons where relevant.
You should write at least 150 words.
Sample Answer:
The given illustration presents data on unemployment rates in England among young adults for two different years. Overall, the unemployment rate among young adults was comparatively lower during 1997 to 2002 and London had more unemployment than that of Rest of the England.
According to the given graph, unemployment rate among young in early 1990 was comparatively higher. Highest unemployment rate was for the age group 16-24 in London among which more than 20% were unemployed. For the same age group unemployment rate for the rest of the England was just above 17%. The unemployment percentage among the all age group in London was also higher (about 14%) than that of other part of England (10%). The unemployment rate ratio in London and in rest of the England for all age group decreased during 1997 to 2002 and after that this rate kept on increasing till 2012. In 2012 the unemployment rate among the age group 16-24 in London was highest (25%) compared to just above 20% for rest of England. Finally these rates among all age groups in London and in rest of the England were very close which was about 7-8%.