IELTS Academic Writing Task 1 with answer.
You should spend about 20 minutes on this task.
The charts below give information about USA marriage and divorce rates between 1970 and 2000, and the marital status of adult Americans in two of the years.
Summarise the information by selecting and reporting the main features, and make comparisons where relevant.
You should write at least 150 words.
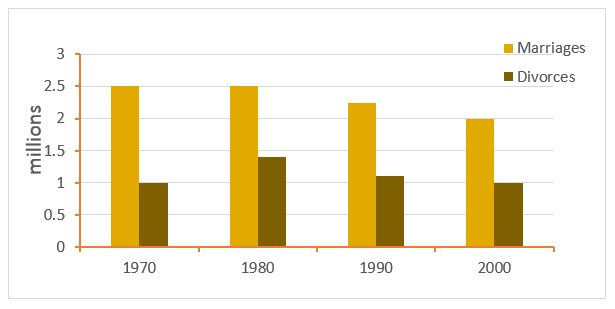
Number of marriages and divorces in the U.S.A. 1970-2000
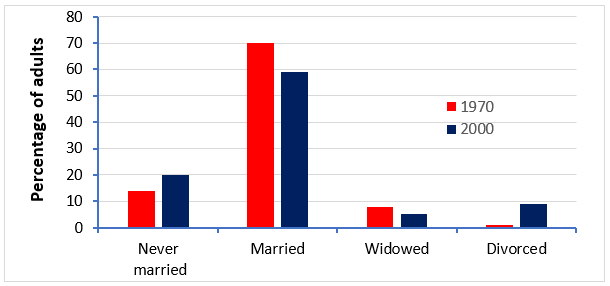
Marital status of adult Americans, 1970 and 2000
Sample Answer:
The bar graphs show the marriage and divorce figure in the USA from 1970 to 2000 and also compare the marital status of American adult citizens for two different years with a gap of 30 years.
According to the first bar graph, in 1970, 2.5 million people got married in the USA while 1 million got divorced. In 1980, the number of marriage remained same as it was 10 years earlier but the total divorce number increased to almost 1.4 million. Again 1990, the overall number of marriage and divorce decreased compared to 1980. This year over 2 million American got married while just over 1 million American got divorced. The trend of divorce in America in this year almost half of the total marriage. Finally in 2000, 2 million American got married against the total divorce of 1 million.
According to the second bar graph, in 1970, about 15% adult Americans never got married while 70% were married and remaining 15% were either divorced or widowed. On the contrary to this, number of married American adults reduced by 11% in the year 2000 while the number of unmarried people and divorced people increased. The data clearly depicts that, the number of divorced and unmarried population in America was higher in 2000 than it was 30 years earlier.