IELTS Academic Writing Task 1 with answer.
You should spend about 20 minutes on this task.
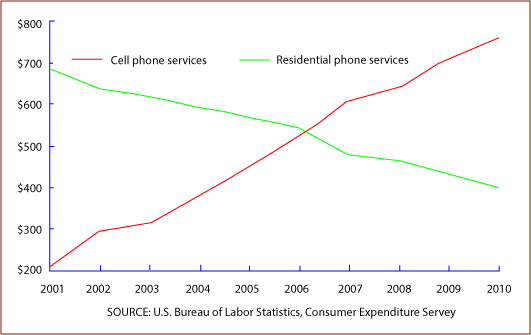
The graph below shows US consumers’ average annual expenditures on cell phone and residential phone services between 2001 and 2010.
Summarize the information by selecting and reporting the main features, and make comparisons where relevant.
You should write at least 150 words.
Average annual expenditures on cell phone and residential phone services, 2001-2010
Sample Answer:
The supplied line graph compares the US citizens’ average yearly expenses for mobile and land phone services for a 10 years’ time. The annual expenses are given in the Y axis while the X axis presents the years from 2001 to 2010. The data is taken from a survey done by Bureau of Labor Statistics on consumer expenditure. Overall, the cell phone service expenditure increased significantly while the opposite is true for the residential phone.
According to the line graph, the average yearly expenses on mobile phone was just over 200 USD initially in 2001 and this expenses rapidly increased over the year. On the contrary, the average cost for the land lines was just below 700 USD and that showed the completely opposite trend as the cost got decreased steadily over the years. After the year 2006 the average costs of these two intersected each other when both was just above $500. After that the average annual cost for cell phone kept on increasing steadily while the average cost for land line kept on falling. Finally in 2010, the expenditure related to cell phone reached to $800 yearly while the cost for residential phones dropped to below $400.