IELTS Academic Writing Task 1 with answer.
You should spend about 20 minutes on this task.
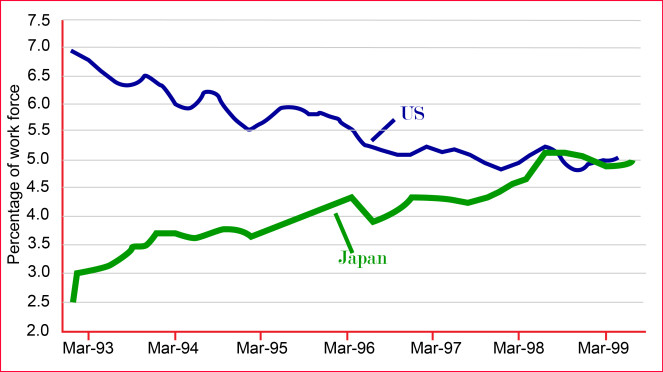
The graph below shows the unemployment rates in the US and Japan between March 1993 and March 1999.
Write a report for a university lecturer describing the information shown below.
You should write at least 150 words.
Unemployment Rates: US and Japan
Sample Answer 1:
The graph below shows the unemployment rates in the US and Japan between March 1993 and March 1999.
The supplied line graph compares the unemployment rates in US and Japan from March 1993 to March 1999. As is observed from the given data, unemployment rate in US was much higher than Japan but over time US managed to decrease this rate while the opposite trend was true for the unemployment in Japan for the given period.
According to the bar graph, unemployment rate in US was 7 in 1993 while this rate was only 2.5 in Japan. Over time the unemployment rate in US decreased with some fluctuations and finally reached to 5% in 1999. The opposite trend could be observed in case of the unemployment rate in Japan. Starting from 1994, the gap between the Japan and US unemployment rate started decreasing and in 1999, the rate became almost same.
In summary, over the time Japan’s unemployment rate increased while US managed to improve their employment market and decreased their unemployment rate.
Answer 2:
The line graph given compares the proportion of work force in two different countries in a given month of the year over a seven year period. An overview of the information shows that the unemployment rates in Japan increased throughout this period whereas in the US, the unemployment rates reduced.
To begin, Japan experienced as gradual rise in the unemployment rates in March between 1993 and 1995. Thereafter, there was a sudden linear increase from 1995 to 1996 before a steep fall was noticed just after March 1996 which later rose to 4.4 before 1997. The peak unemployment rate was experienced within the last two years.
Contrasting, the unemployment rate of the US peaked in the first year. Subsequently, these rates reduced gradually but not in a directly proportionate pattern to the progression of the years. The US experienced its lowest unemployment rate between March 1998 and 1999.
In conclusion, I can deduce from the graph that as the unemployment rates of US decreased the unemployment of Japan increased and the reason for this is yet to be unravelled.