IELTS Academic Writing Task 1 with answer.
The graphs provide information about the price of gold between the years 1400 and 2000 and the actual and projected prices between 2004 and 2016.
Summarise the information by selecting and reporting the main features, and make comparisons where relevant.
You should spend about 20 minutes on this task.
You should write at least 150 words.
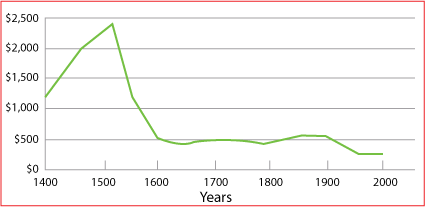
Gold prices per ounce from 1400 to 2000 in US$ at 2011 value
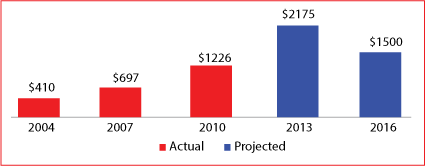
Gold prices from 2004 and projections to 2016 in US$
IELTS Academic Writing Task 1: Sample Answer
The given line graph presents information about gold price from the years 1400 till 2000 and the bar graph gives projection of the gold price from 2014 till 2016. The price of gold was given in US dollar and the price is calculated based on the value of dollar in 2011.
According to the line graph, the price of gold was much higher in the 16th century while it dropped after the year 1600. Initially in the year 1400, the price of gold per ounce was about 1200 US dollar and it kept on increasing till 16th century. Approximately around the year 1520 the highest price of gold could be seen which was about 2400 dollar per ounce. Then the price dropped significantly and reached to only 500 dollar per ounce in the 17th century. Till then the price showed very minor fluctuation and it was less than 300 dollar/ per ounce in the year 2000.
The bar graph shows that the gold price was almost three times higher in 2013 ($1226) than it was in 2004 ($410). The price increased to over 2 thousand dollar in 2013 and it is projected that it will drop to 1500 USD in 2016.