IELTS Academic Writing Task 1 with answer.
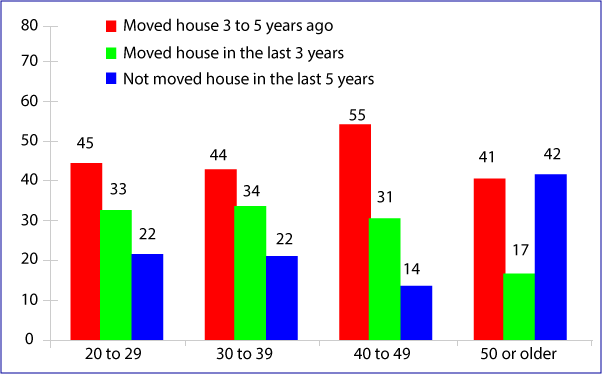
The chart shows the percentage of people who have moved house either in the last 3 years, between 3 to 5 years or not within the last 5 years.
Summarise the information by selecting and reporting the main features, and make comparisons where relevant.
You should spend about 20 minutes on this task.
You should write at least 150 words.
IELTS Academic Writing Task 1: Sample Answer
The supplied bar chart presents data about the percentage of people who moved their living places based on their age groups. As is observed from the graph, older people tend to change their living places less frequently while most of the people changed their houses 3 to 5 years ago.
As is presented in the graph, 45 percent people from 20 to 29 age group who changed their houses did so 3 to 5 years ago. 33% of this people changed their houses in the last three years while 22% did so more than 5 years ago. People of 30 to 39 age group had a similar tendency of changing home as did the earlier age group had. People of 40 to 49 years old changed their house mostly (55%) in 3 to 5 years ago. 34% and 22% people of this age group changed their houses in the last three years or in more than 5 years respectively.
Finally the senior citizens who changed their homes in the last three years comprised the least percentage which was 17. Remaining 83% of older people did not change their living place in the last 3 years.

