IELTS Academic Writing Task 1 with answer.
You should spend about 20 minutes on this task.
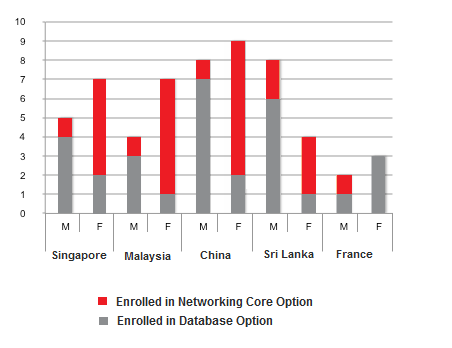
The bar chart shows the number of overseas students enrolled in a third year Computer Science course at a Canadian college.
Summarise the information by selecting and report in the main features, and make comparisons where relevant.
Write at least 150 words.
Sample Answer:
The given illustration presents information on the overseas students who got admitted in a Canadian College in a third year Computer Science course. Students in this course came from five different countries and they either chose networking or database for this course.
According to the bar graph, Chinese students were highest in number among the students of five different countries. Among eight Chinese students, seven male students enrolled in database option while 7 female students got enrolled in networking among the total of nine. Total numbers of Singaporean students in this course was 12 and among them 5 were male and 7 were female. 4 male students were in database while only 2 female were in database. Rest of the students was in networking.
Total number of Malaysian, Sri Lankan and French students in this third year courses were 11, 12 and 5 respectively. Among Malaysian male students 3 got enrolled in database while 6 female students were in networking. In case of Sri Lankan students only two were in database while rest of them was in networking. Finally, French students number was the least among the given five countries which was only 5 and all of their female students chose networking while only one male student took database.
Overall, more male students picked database as their subject in third year in this Canadian college while majority of female students from this major chose database.

