IELTS Academic Writing Task 1 with answer.
You should spend about 20 minutes on this task.
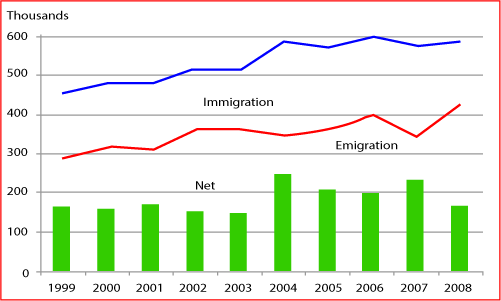
The graph below shows the long-term international migration, UK, 1999-2008.
Summarize the information by selecting and reporting the main features, and make comparisons where relevant.
You should write at least 150 words.
Long-Term International Migration, UK, 1999-2008
Sample Answer:
The provided illustration presents data on long-term international immigration and emigration in the United Kingdom from 1999 to 2008. Overall, the net migration in UK showed some fluctuation throughout the years but it was highest in the year 2004.
According to the presented graph immigration (moving to a country) was higher than the long term emigration. In 1999, number of immigration was over 450 thousand while the short term emigration was just below 300 thousand. Both the number of immigration and emigration in UK showed some fluctuations but immigration number was always higher than the number of emigration. After 10 years in 2008, the short term migration was just over 400 thousand while the long term migration was just below 500 thousand.
The net migration in 1999 was over 150 thousand and it reached to the highest in 2004 with the total number of about 250 thousand. This net number in 2007 was second largest (over 220 thousand). Finally in 2008 the net migration in the UK reached to about 180 thousand.

