IELTS Academic Writing Task 1 with answer.
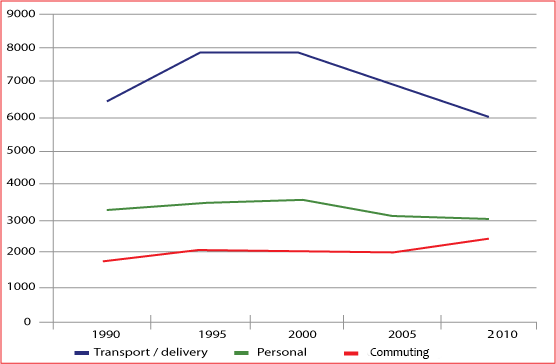
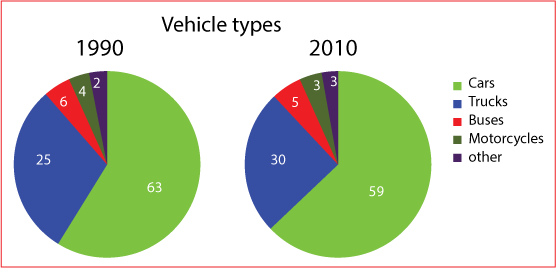
The charts below show information about the number of kilometres travelled in an average month and the distribution of vehicle types in Britain.
Summarise the information by selecting and reporting the main features, and make comparisons where relevant.
You should spend about 20 minutes on this task.
You should write at least 150 words.
IELTS Academic Writing Task 1: Sample Answer
The given illustration presents information about the average distance travelled per month by the British citizens as well as the types of vehicles they used to travel this distance. As is observed from the graph, car was the most preferred vehicle in Britain and delivery transportation, personal and commuting were the three major reason s for travelling.
According to the first line graph, more than six thousand kilometer distance was travelled per month by British citizens in 1990 for delivery transportation. In this year they travelled more than three thousand km for personal travel in a month and about 2 thousand km of their travel was due to commuting. Over the period the delivery transportation remained the major reason for travelling in Britain and it increased to about 8 thousand km per month. In later years the commuting travelling distance increased while other two needs for travelling decreased. In 2010, delivery travelling was six thousand km/ month (which was highest) while personal travel per month reached to three thousand km and commuting contributed to about 2500 km travel per month.
Car was the most preferred vehicle to travel in Britain which contributed to 63% of total travel in 1990 and 59% in 2010. Truck was second most preferred vehicle type that was used around one fourth of total distance travelled. The use of buses, motorcycles and others vehicle types remained less popular and were used for about 2 to 6 percentage of total travel both in the 1990 and 2010.


