IELTS Academic Writing Task 1 with answer.
You should spend about 20 minutes on this task.
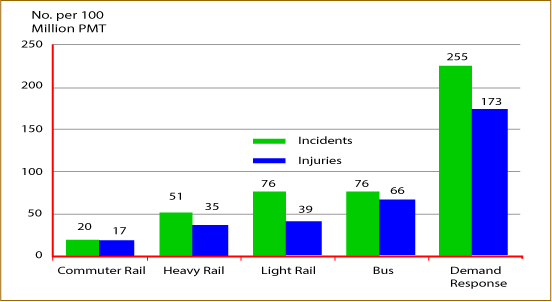
The chart below shows numbers of incidents and injuries per 100 million passenger miles travelled (PMT) by transportation type in 2002.
Summarize the information by selecting and reporting the main features, and make comparisons where relevant.
You should write at least 150 words.
Incidents and Injuries per 100 Million PMT, 2002
Sample Answer:
The given illustration presents information about the accident incidents as well as injuries from that per 100 million passengers travelled by four different transportation types in the year 2002. As is seen from the given bar graph, in 2002, total incident demand was 255 while the response was 173.
According to the given bar graph, there were 20 incidents in case of commuter rail in the year 2002 while the injury was 17. The given incidents and injuries were given for per 100 million passenger miles travelled. In case of Heavy Rail the number of incidents was 51 while the total injury was 35. Finally the incidents in Light Rail and Bus were highest (76) while the injury in bus (66) was higher than the injury from Light Rail (39).
Total number of Demand of incidents was 255 compared to the response of 173 in 2002 in case of incidents injury caused by four different transportation types.