IELTS Academic Writing Task 1 with answer.
You should spend about 20 minutes on this task.
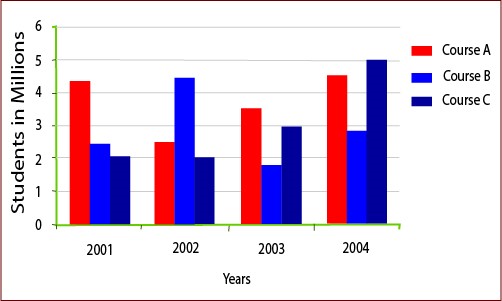
The bar chart below shows the number of students in three courses from 2001-2004.
Identify and summarize the main data presented on the graph.
You should write at least 150 words.
Number of Students Attending Three Courses From 2001-2004
Sample Answer:
The provided graph gives information about the students in three different courses in millions for a four years time. Overall Course A received the highest number of students in these years but in 2004 Course C became most popular.
According to the given bar graph, more than 4 million students enrolled in Course A in 2001 while two other courses received around 2 million students each. In the next year the highest number of student (around 4.5 million) enrolment could be observed in Course B while that remained unchanged for Course C. In this year the number of students in Course A decreased by about 2 million. The overall students number in 2003 decreased where Course A, B and C got about 3.5, 1.8 and 3 million students respectively. Finally in 2004, highest number of students enrolled in these three courses (approximately 12 millions) which was significantly higher than that of 8 million in 2001. In 2004 5 million students were in Course C which was largest in terms of students’ number. This year less than 3 million students got enrolled in Course B and about 4.5 million in Course A.

