IELTS Academic Writing Task 1 with answer.
You should spend about 20 minutes on this task.
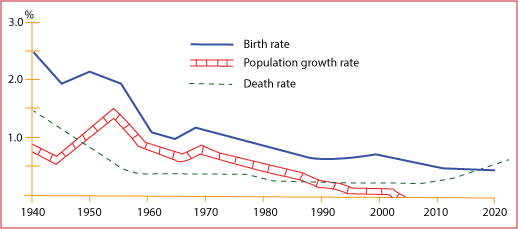
The figure shows demographic trends in Scotland.
Summarize the information by selecting and reporting the main features, and make comparisons where relevant.
You should write at least 150 words.
Demographic Trends (Scotland)
Sample Answer:
The given illustration presents information on the demographic trend in Scotland. As is observed from the graph, birth rate, population growth rate and death rate of Scotland decreased in the recent years and it is forecasted that the death rate would increase after 2015.
As is given in the given diagram, Scotland had 2.5% birth rate, about 1.5% death rate and nearly .8% population growth rate early in 1940. After 10 years, the death rate decreased while the two other increased than it was in mid 1940s. The population growth rate reached to its highest level after 1955 with a rate of over 1.5%. During this time the birth rate and death rate were around 2.0% and .5% respectively. The death rate intersected the population growth rate twice and first time in around 1948. After 1960 the population growth rate in Scotland kept on falling and reached to 0 around in 2004. During this time the birth rate and death rate were about .8 and .2% respectively. It is projected that the population growth rate would remain in 0% till 2020 while the birth and death rates would intersect each other in 2018 at around .8%. After that the birth rate would remain steady while the death rate would increase.