IELTS Academic Writing Task 1 with answer.
You should spend about 20 minutes on this task.
The pie charts below give data on the spending and consumption of resources by countries of the world and how the population is distributed.
Write a report for a university lecturer describing the information shown below.
You should write at least 150 words.
Sample Answer:
The given illustrations gives information about the resource consumptions, spending and population distribution in the world.
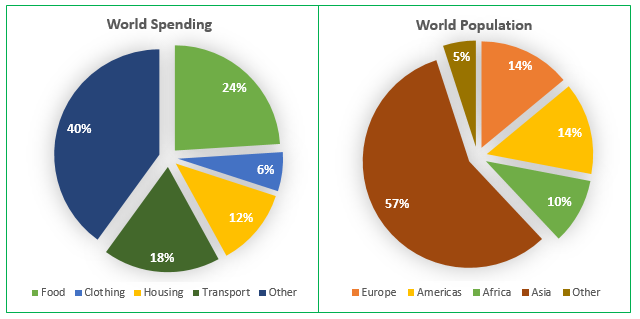
The first pie chart shows the world spending in food, clothing, housing, transports and others. As is given in this pie chart, almost quarter of the total world spending is made for foods while clothing expenses is 6%. The expenses in housing and transports are consecutively 12 and 18 percent while all other expenses in 40%.
The second pie chart represents data on population distribution in Europe, America, Africa, Asia and other regions. As is shown in this pie chart, more than half (57%) of the world population reside in Asian region while in Europe and America have 14% world population each. Africa has 10% world population and the remaining 5% people live in other parts of the world.
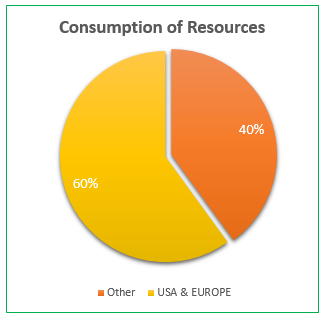
Final graph presents data on the resource consumption in the world diving in two main categories: USA & Europe and all other parts of the world. Interestingly USA and Europe consume 40% world resources though they support only 28% of the world population. For the remaining 72% world population total resource consumption is the rest 60%.