IELTS Academic Writing Task 1 with answer.
The graphs below show information on the production of consumer goods and the consumption of television sets in Russia.
Write a report for a university lecturer describing the information in the graphs below.
Summarize the information by selecting and reporting the main features, and make comparisons where relevant.
You should spend about 20 minutes on this task.
You should write at least 150 words.
IELTS Academic Writing Task 1: Sample Answer
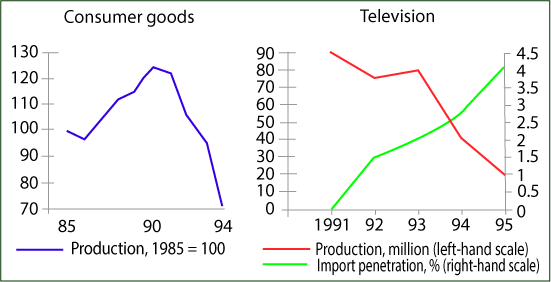
The given diagram gives information about the production of consumer goods and consumption of televisions in Russia. The left line chart shows the production of consumer goods from 1985 till 1994 while the right hand diagrams shows data on production in millions and import penetration in percentage.
As is seen in the first line graph, total production of consumer goods in Russia in 1985 was 100. The number of production for consumer goods increased steadily till 1991 and reached in summit with over 120 units in 1990. After 1991, the production started falling sharply and reached to about 70 units in 1994.
On the other hand, TV sets productions in 1991 was 90 units and that reached to about 80 units in around 1993. This production started declining and reached to about 20 units in 1995. The import penetration of it was 0% in 1991 and it gradually increased till it reached to 4% in 1995.