IELTS Academic Writing Task 1 with answer.
You should spend about 20 minutes on this task.
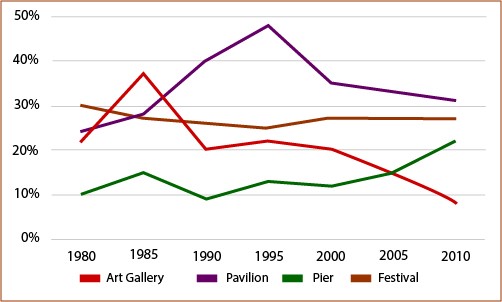
The line graph below shows the percentage of tourists to England who visited four different attractions in Brighton.
Summarise the information by selecting and reporting the main features, and make comparisons where relevant.
You should write at least 150 words.
Sample Answer:
The supplied diagram presents information about the visitors’ percentage in four different attractions namely art gallery, pavilion, pier and festival in Brighton. Overall more tourists preferred visiting pavilion while the attractions of art gallery among tourists decreased over time.
As is presented in the line graph, initially in 1980, 10% tourists in England visited pier in Brighton which was the least percentage among the give four spots. In this year festival attracted highest percentage of tourists (30%) while art gallery and pavilion received about 22-25% of total tourists. After 5 years the percentage of visit in art gallery by tourists in England rocketed and reached to over 38%. In this year this was the highest percentage of visit among the given four attractions. At that time popularity of pier and pavilion both increased with 15% and about 27% respectively while the opposite trend could be observed in case of the festival. After 1985, the popularity of pavilion started booming and reached to the pick at about 48% in 1995. In this year festival and art gallery managed to get about 22-25% tourists. Finally in the year 2010, the percentage of tourists in art gallery reached to its lowest (below 10%) while pavilion received more than 30% of tourists which was the highest. The other two attractions received about 22-28 percent tourists in this year.