IELTS Academic Writing Task 1 with answer.
You should spend about 20 minutes on this task.
The chart below shows the amount of money per week spent on fast foods in Britain. The graph shows the trends in consumption of fast foods.
Write a report for a university lecturer describing the information shown below.
You should write at least 150 words.
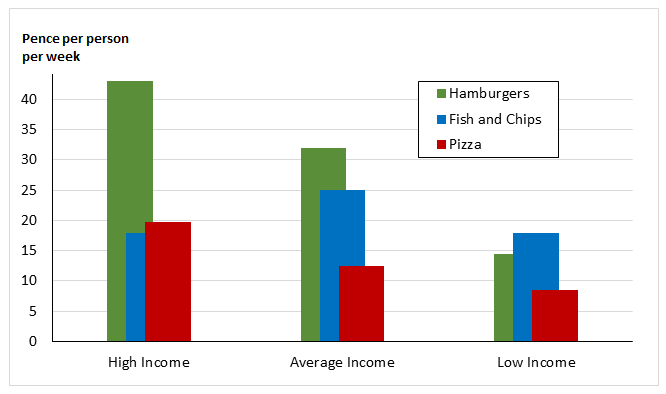
Expenditure on fast foods by income groups
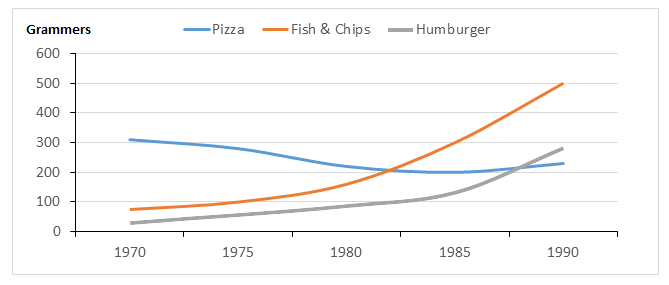
Consumption of fast foods 1970 -1990
Sample Answer 1:
The given graphs show data on the British people’s expenditure on fast food and also describe the amount consumed by them from 1970 to 1990.
The bar graph divides the expenditure of British citizens on fast food items in three categories based on their income range. As is shown in the graph, people with high income capacity spent highest amount on Hamburgers. Their expenditure on Pizza and chips was almost half of the expenditure of Hamburger. The average income group in Britain also spent highest amount on Hamburger but spent more on chips and fish items than the high income group. Among the low income group British, expenditure on chips was highest. Expense on Pizza was least among this low income group British.
The line graph compares the consumption of three given first food items and as is observed, initially in 1970 Pizza was the most popular items. More than 300 grams Pizza was consumes by each British on an average in this year while chips and Hamburger were consumed less than 100 grams in this same year. The consumption and popularity of fish & chips increased over time and became the most popular fast food item in 1990. Popularity of Hamburger and chips increased over the 20 years and the popularity of Pizza decreased and reached to just over 200 grams per person in 1990.
Sample Answer 2:
The bar graph compares the weekly expenditures of British people, categorized by three income groups, on fast food items namely hamburgers, fish and chips, and pizza. The line graph demonstrates different trends in consumption of these fast food items between 1970 and 1990.
Overall, it is evident that hamburgers were the most favorite food of the people who earned a high salary while low-income people spent the most amount of money on fish and chips. The popularity of hamburgers and pizza increased over a period of twenty years while that of pizza followed an opposite trend.
Analysis of bar chart reveals that high income and average income people spent most of their money on hamburger sat 42 pence and 32 pence respectively. However, most of the expenditures of people with a low salary were on fish and chips, at about 20 pence per week. Pizza remained the second preferred item of high-earning people, at 20 pence, while the other two groups spent the least amount on this item, at about 10 pence by average income and almost 8 pence by low-income people.
Turning to the line graph, consumption rates of hamburgers saw a steady increase from nearly 100 grams to more than 500 grams over the period. Similarly, the amount of pizza eaten by British people rose gradually from a low of 50 grams to almost 280 grams. However, the trend for fish and chips fell by 80 grams over the period.
[fusion_builder_container hundred_percent=”yes” overflow=”visible”][fusion_builder_row][fusion_builder_column type=”1_1″ background_position=”left top” background_color=”” border_size=”” border_color=”” border_style=”solid” spacing=”yes” background_image=”” background_repeat=”no-repeat” padding=”” margin_top=”0px” margin_bottom=”0px” class=”” id=”” animation_type=”” animation_speed=”0.3″ animation_direction=”left” hide_on_mobile=”no” center_content=”no” min_height=”none”][ Written by – Umber Waqar] [/fusion_builder_column][/fusion_builder_row][/fusion_builder_container]