IELTS Academic Writing Task 1 with answer.
You should spend about 20 minutes on this task.
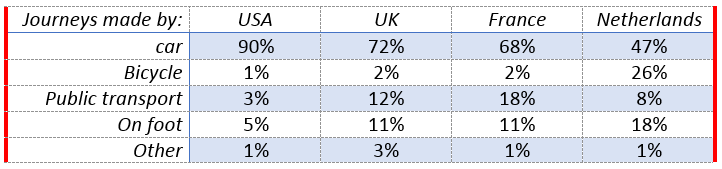
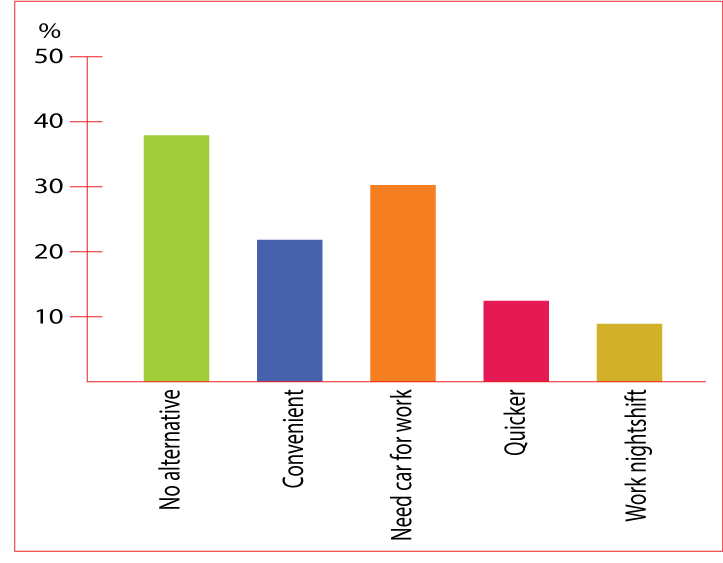
The table shows the percentage of journeys made by different forms of transport in four countries. The bar chart shows the results of a survey into var use.
Summarize the information by selecting and reporting the main features, and make comparisons where relevant.
You should write at least 150 words.
Most cited reasons people travel to work by car(USA)
Sample Answer:
The table data summarise the types of transports citizens in four countries used while the bar graph outlines why Americans prefer using cars to reach their workplaces. Overall, the private car was the most preferred vehicle type in the USA and UK while Americans believe they mainly use cars for mainly it is quicker, convenient and the best mean of transport.
According to the table data, nine out of ten Americans use the car while 5% walks. Only 1% of them use a bicycle and 3% take public transportation. Again, more than 70% British prefer car as their primary means of transportation while 2% use bicycle. Just over 20% of them either walk or use public transports. On contrary to that, 18% French use public vehicles and 11% prefer walking. More than 60% prefer using cars and 2% ride a bicycle. Finally, less than half of the population in the Netherlands use cars and more than one-fourth of them ride bicycles. The percentage of Netherlands’s citizens who walk is highest, 18%, and 8% of them prefer to take public transportation service.
The bar graph depicts that, one-quarter Americans think that they do not have an alternative to their personal cars to travel to work. Around the same percentage of them think they need a car for work and 10% believe this means of transportation is faster.