IELTS Academic Writing Task 1 with answer.
You should spend about 20 minutes on this task.
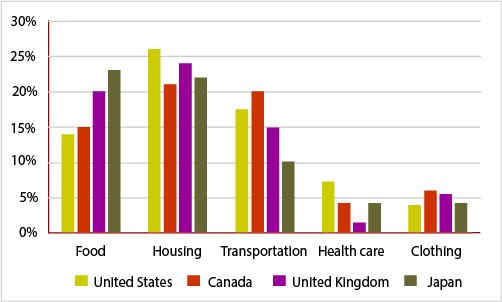
The bar chart below shows shares of expenditures for five major categories in the United States, Canada, the United Kingdom, and Japan in the year 2009.
Write a report for a university lecturer describing the information below.
You should write at least 150 words.
Shares of expenditures for selected categories,
United States, Canada, United Kingdom, and Japan, 2009
Sample Answer:
The The given bar graph presents data on the expenses made by citizens of US, Canada, UK and Japan in five important categories in the year 2009. As is observed from the given illustration, housing costs were higher than any other categories and healthcare and clothing received the least expenses by the people of these four given countries.
According to the given bar chart, most expenditure by the people of the given four countries was made in housing. In the United States, the proportion of expenses made in housing was highest (over 25%) among the given countries. In other countries, housing remained as the most expensive category with over 20 percent total expenses. Second most expensive category was food in Japan and in UK with over 20% share of total expenditure. For US and Canada Transportation was the second most expensive category while food was their third most expensive which cost around 17 to 20% of their total expenditure.
Healthcare and clothing were the least two expensive sectors. Only US people made more than 5% expenditure in healthcare while this was less than 5% in other three countries. Finally, clothing comprised just over 5% of total expenditure in Canada and in UK while this was less than 5% in Japan and US.