IELTS Academic Writing Task 1 with answer.
You should spend about 20 minutes on this task.
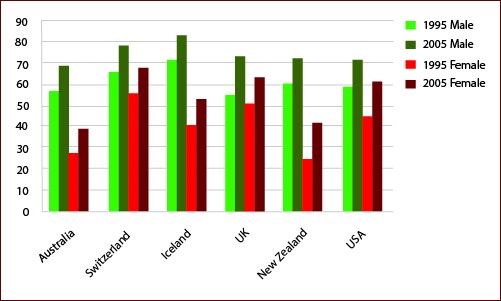
The graph show information of employment rates across 6 countries in 1995 and 2005.
Summarize the information by choosing and describe the main idea, and make comparisons where appropriate.
You should write at least 150 words.
Sample Answer:
The supplied bar graph provides information about the employment in six different countries both for male and female for a ten years period commencing from 1995. As it can be observed from the bar graph, employment rate both among men and women increased in 2005 than that of 1995.
According to the given graph, about 60% Australian Male had jobs compared to about 28% women employment in 1995. After 10 years both male and female employment increased and in Australia this reached to about 70% for male and 40% for female. Switzerland had the highest percentage of working male and female both in 1995 and 2005. In 1995, about 66% male had jobs while it was about 27% for female. These percentages increased to about 80% for male and about 70% for female 10 year later.
In case of Iceland, the working males in 1995 were just above 70% while female comprised 40%. These percentages of employment increased both for male (more than 80%) and female (more than 50%). In the given period, Iceland had the best employment ratio for men but not for the women. The United Kingdom and the United States had almost similar patterns in terms of employment while female in New Zealand had slightly less employment opportunity compared to the former two countries. About 60% men were employed in these three countries in 1995 which increased to around 70% in 2005. In case of women employment UK had slightly better condition than the USA and New Zealand.