IELTS Academic Writing Task 1 with answer.
The graph below presents the employment patterns in the USA between 1930 and 2010.
Summarize the information by selecting and reporting the main features, and make comparisons where relevant.
You should spend about 20 minutes on this task.
You should write at least 150 words.
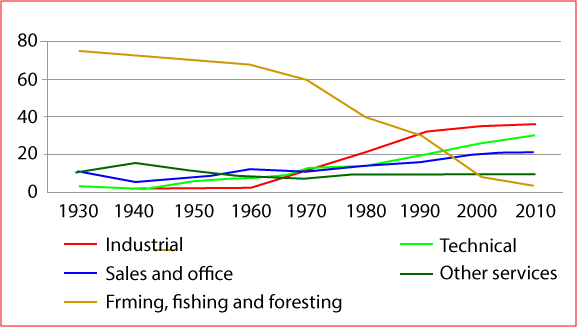
USA labour force Employment, 1930-2010
IELTS Academic Writing Task 1: Sample Answer
The given line graph compares the labour force employment pattern in the USA from 1930 to 2010. As is obvious from the given illustration, employment in the USA in farming, fishing and foresting sectors reduced significantly during the given period and industrial and technical labour force became dominant in the later years.
According to the given line graph, there were about 78% farming, fishing and foresting labour forces in the USA in 1930. At that time industrial labour force was not present and other three labour forces were less than 30% in combination. Technical labour force had the lowest percentage with only 2-3%. With times the farming, fishing and foresting labour force gradually reduced and reached to 60% in 1970. At that time other labour forces were almost similar with the approximate 10% labour force share in the USA. After 1970s, the industrial labour force started growing while the growth could be observed in technical sector as well. In 2010, the industrial labour forces made the largest portion of the USA labour market with about 38% labour force while the farming, fishing and foresting labour forces fell to the lowest percentage with only 2-3%. Sales and office labour force in this year was just above 20% from initial 10% in early ages.
In short, the USA labor market was mainly dependent on farming, fishing and foresting from 1930 to 1970 but in recent years industrial labours and technical labours hold the main labour market share.