IELTS Academic Writing Task 1 with answer.
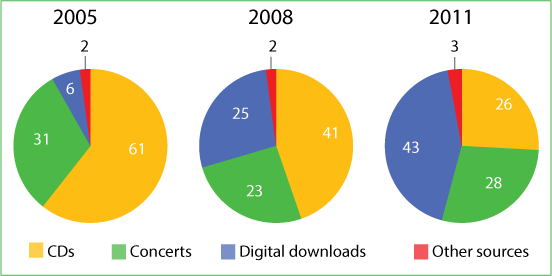
The charts show the distribution of money spent on music in three different years in Northern Ireland.
Summarise the information by selecting and reporting the main features, and make comparisons where relevant.
You should spend about 20 minutes on this task.
You should write at least 150 words.
IELTS Academic Writing Task 1: Sample Answer
The given bar graphs compare the money spent on music in three different years in Northern Ireland. The music lovers spent money for buying CDs, watching concerts, online downloads and in other sources and the illustration compares the spending on music in 2005, 2008 and 2011 in Northern Ireland.
As is presented in the graph, more than 60% spending on music went in buying CDs while it was 31% for enjoying concerts. The remaining 8% money was spent by music lovers either by downloading music or in other forms. This trend on spending for music changed after 3 years when CDs were still the main source of income for music industries as more than 40% spending was done in purchasing CDs. The spending on concert decreased from 31% to 23% in 3 years while spending on online music download increased significantly (one fourth of total spending). In the final year (2011) the digital download of music became the major distribution of money spending (over 40%) while CDs lost their popularity with 26% share of total spending. The spending on concert increased ((28%)) than it was three years earlier though it was still less than that of 2005. Other sources of spending were only 3% but that was 1% increase than the previous two given years.