IELTS Academic Writing Task 1 with answer.
You should spend about 20 minutes on this task.
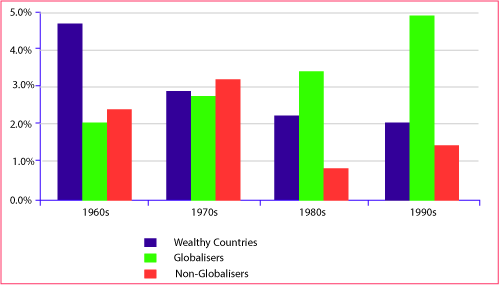
The graph below shows the average growth in domestic products in wealthy countries, countries that have adopted a global approach to business and countries that have not.
Summarize the information by selecting and reporting the main features, and make comparisons where relevant
You should write at least 150 words.
Average annual Gross Domestic Product (GDP) growth
Sample Answer:
The given bar graph presents information about the average annual domestic product (GDP) growth in wealthy, globaliser and non-globaliser countries for a period of 40 years commencing from 160. As is presented in the given illustration, wealthy nations had far better GDP in 1960 but in later decades the growth of GDP was far better in globaliser countries.
According to the given bar graph, average annual Gross Domestic Product which is shortly known as GDP was far higher in wealthy nations (about 4.7%) than the globaliser (2%) and non-globaliser (about 2.4%) countries in 19960. After 10 years the GDP growth in wealthy countries declined and reached to just below 3% while this rate increased both for the globaliser and non-globaliser countries which were about 3%. In later years the GDP rates in wealthy countries kept on decreasing while this rate increased significantly in globaliser countries. Overall the GDP in non-globaliser countries decreased and reached to about 1.5% in 1990s. In this decade the GDP in globaliser countries was highest (approximately 5%) while it was 2% in wealthy countries.