IELTS Academic Writing Task 1 with answer.
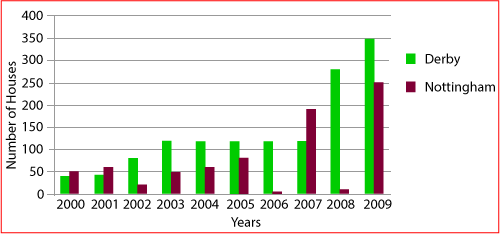
The diagram below shows the number of houses built per year in two cities, Derby and Nottingham, Between 2000 and 2009.
Write a report for a university lecturer describing the information shown below.
You should spend about 20 minutes on this task.
You should write at least 150 words.
The number of house built per year in the cities of Derby and Nottingham
IELTS Academic Writing Task 1: Sample Answer
The given bar graph compares the construction of houses per year in Derby and Nottingham from 2000 to 2009. As is seen from the given illustration, more houses were built in Derby city than that of Nottingham except for the first two years and between 2006- 2007.
As the bar graph depicts, only 50 houses were built in Nottingham in 2000 compared to about 40 in Derby. The figure for the next year was almost similar but in 2002 more than 70 houses were constructed in Derby while it was only 20 in Nottingham. From this point, the new construction of houses in Derby was more in number than that of Nottingham except in 2006 & 2007. An overall increase in the construction of new houses could be observed in both cities except in 2006 and 2007 when very few new houses could be observed. In the final year, 2009, 350 new houses were made in Derby compared to 250 in Nottingham.