IELTS Academic Writing Task 1 with answer.
You should spend about 20 minutes on this task.
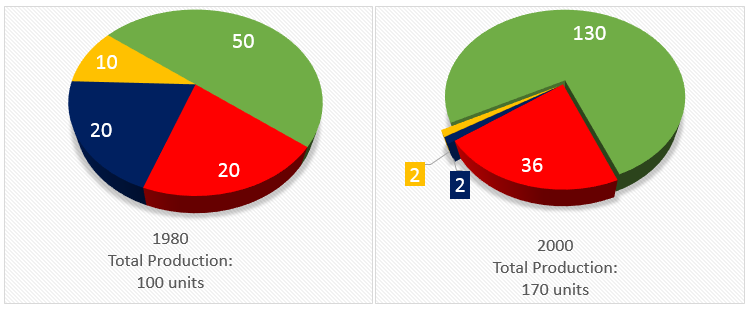
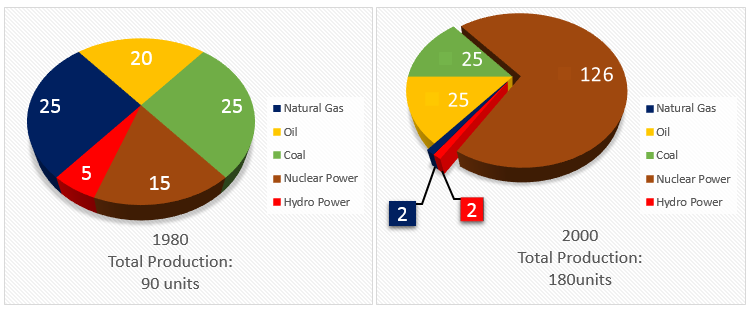
The pie charts below show units of electricity production by fuel source in Australia and France in 1980 and 2000.
Summarise the information by selecting and reporting the main features, and make comparisons where relevant.
You should write at least 150 words.
Units Of electricity by fuel source in Australia
Units of electricity by fuel source in France
Sample Answer:
The given pie charts present information about electricity production from fuels in Australia and France. As is shown in the given illustration, coal was the mail source of electricity production in Australia while France produced more electricity from nuclear power in 2000 than they did in 1980.
The first diagram show that, Australia produced 100 units of electricity in 1980 and 50 units of it came from coals. The remaining 50 units of electricity were produced from hydro power, natural gas and oil. After 20 years, total electricity production in Australia increased to 170 units and 130 of it was produced from coals. 36 units of this electricity were generated from hydro power and remaining 4 units came from natural gas and oil.
On the other hand, the second diagram illustrate that France produced 90 units of electricity and coal and natural gas was the main source of this electricity production. 20 units of electricity was generated from oil in this year while 15 units were produced using the nuclear power. After 20 years the use of nuclear power to generate electricity in France increased dramatically and out of 180 units 126 were produced using this source. Coal use remained unchanged and oil contributed to 25 units of electricity production.