IELTS Academic Writing Task 1 with answer.
You should spend about 20 minutes on this task.
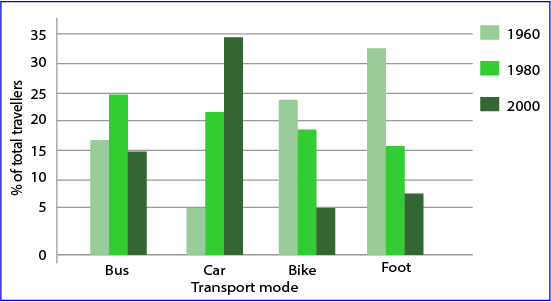
The following bar chart shows the different modes of transport used to travel to and from work in one European city in 1960, 1980 and 2000.
Summarize the information by selecting and reporting the main features, and make comparisons where relevant.
You should write at least 150 words.
Transport modes in a European city 1960-2000
Sample Answer:
The provided bar graph presents data on the types of vehicles used to reach to and from offices in a European city in three different years. Overall, the dependency on car has increased significantly and more people used to reach office and get back home using bike and by walking in early 1960s than they did later on.
According to the bar graph, initially in 1960, more than 15 percent travelers used buses to reach office or to get back home from office. The percentage of car usages in this year was only 5 percent. More than 24 percent of total travelers used bike while the largest percentage of people used to walk which was more than 32%. After 20 years, the dependency on buses for travelling increased to approximately 25% while it was just over 20% for personal car. Less people in this decade started using bike and walking to get to and get back from work places. Finally in the year 2000, highest percentage of people used personal cars (about 35%) while 15% of total travelers used bus as their primary means of office transportation. People who walked or used bike to reach offices got decreased in percentage and they consisted 5 and about 7% respectively.

