IELTS Academic Writing Task 1 with answer.
You should spend about 20 minutes on this task.
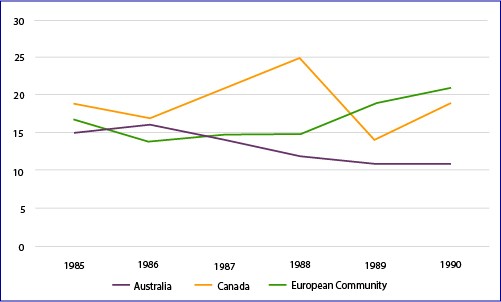
The graph below shows the differences in wheat exports over three different areas.
Write a report for a university lecturer describing the information shown below.
You should write at least 150 words.
Sample Answer:
The given line graph presents information about the wheat exports in Australia, Canada and European Community from 1985 to 1990. As is seen from the illustration, Canada was the largest wheat exporting country in 1985 but European Community replaced Canada in 1990.
As is presented in the line graph, wheat export by Canada was about 18 units which was highest among the given three areas. In this year the export quantity in Australia and European community was around 16 and 15 units.
Over the years the export quantity in Australia decreased except in 1986 and gradually reached to just over 10 units in 1990. On the contrary, European community managed to export the highest unit of wheat in this year. Canada exported highest quantity of wheat in 1988 which was 25 units. In 1990 Canada stood in the second place in terms of wheat export with about 18 unit wheat export.

