IELTS Academic Writing Task 1 with answer.
You should spend about 20 minutes on this task.
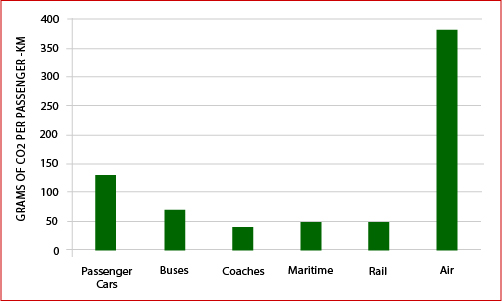
The Bar Chart shows CO2 emissions for different forms of transport in the European Union.
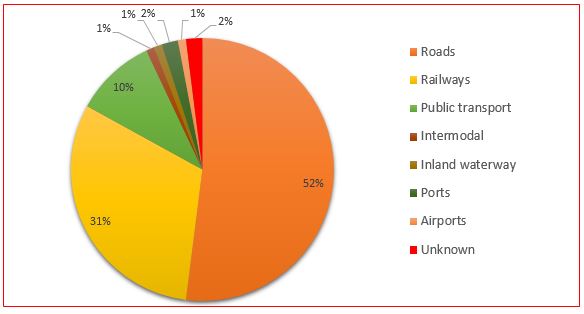
The Pie Chart shows the percentage of European Union funds being spent on different forms of transport.
You should write at least 150 words.
Sample Answer:
The Bar Chart shows CO2 emissions for different forms of transport in the European Union.
The Pie Chart shows the percentage of European Union funds being spent on different forms of transport.
Sample Answer: The given bar graph presents data on Carbon Dioxide releases from six different types of transport in the EU countries.
According to the first bar graph, aero planes release the highest amount of CO2 in European Union countries which is about 380 grams per passenger kilometer. The second largest Carbon Dioxide producing vehicle type is passenger car that produce around 130 grams of CO2 per passenger kilometer. Coaches, Maritime and Rail transportation release comparatively less (around 50 gm.) CO2 per passenger km. Buses release over 50 gm. CO2 per passenger km and this is comparative safer than the aero plane and personal car in terms of CO2 emission.
As is given in the pie chart, more than half of the total CO2 emission in EU countries are caused due to the road transportation as the number of roads transportation must be greater in number. Rails contribute to about one third of total CO2 release while public transportation produces 10% of total CO2 productions. All other transportation types (airplanes, ports, inland water transportation, inter-modal etc.) combinedly contributes to less than 10% of total CO2 emission.