IELTS Academic Writing Task 1 with answer.
You should spend about 20 minutes on this task.
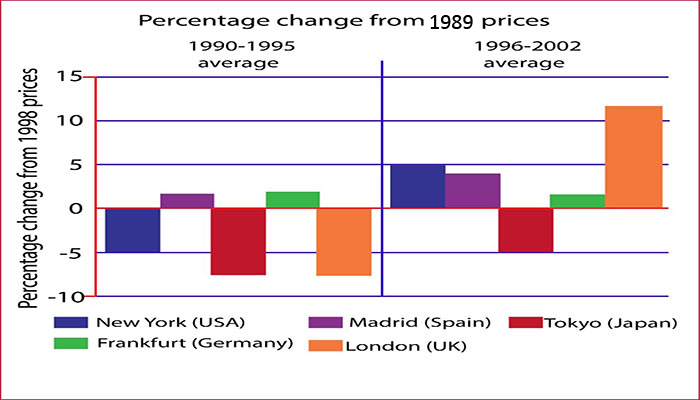
The chart below shows information about changes in average house prices in five different cities between 1990 and 2002 compared with the average house prices in 1989.
Summarise the information by selecting and reporting the main features, and make comparisons where relevant.
You should write at least 150 words.
Percentage change in average house prices in five cities 1990-2002 compared with 1989
Sample Answer:
The provided bar graph compares the housing price changes in five cities between the years 1990 and 2002 with the price of 1989. As is observed from the graph, average prices of houses in New York, Tokyo and London decreased between 1990 and 1995 compared to the average prices of 1989. On the other hand, prices increased in New York, Madrid, Frankfurt and London between 1996 and 2002.
As is observed from the given chart, housing costs in Madrid, Spain and Frankfurt, Germany increased by 2-3 % compared to the prices in 1989. On the contrary, prices of houses in New York, Tokyo and London decreased by 5% – 7%.
From the data given in the chart it is clear that housing prices in New York and London increased by 5% and 12% consecutively. Again, prices in Madrid increased by 2% than it was between 1990 and 1995. The housing costs in Frankfurt, Germany remained almost same as it was in earlier 1990.