IELTS Academic Writing Task 1 with answer.
You should spend about 20 minutes on this task.
The three pie charts below show the changes in annual spending by a particular UK school in 1981, 1991 and 2001.
Summarise the information by selecting and reporting the main features, and make comparisons where relevant.
You should write at least 150 words.
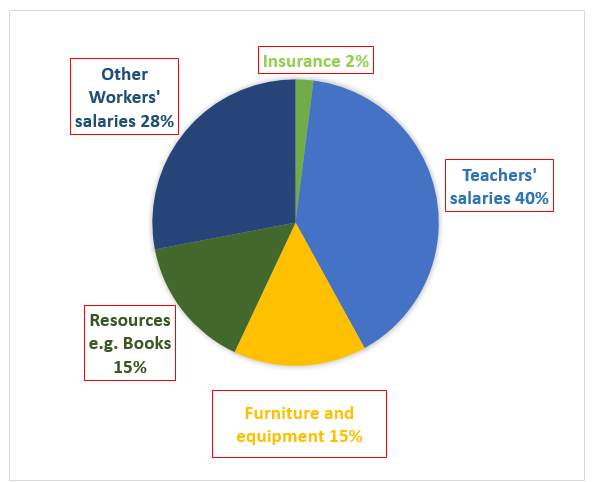
Total School Spending 1981
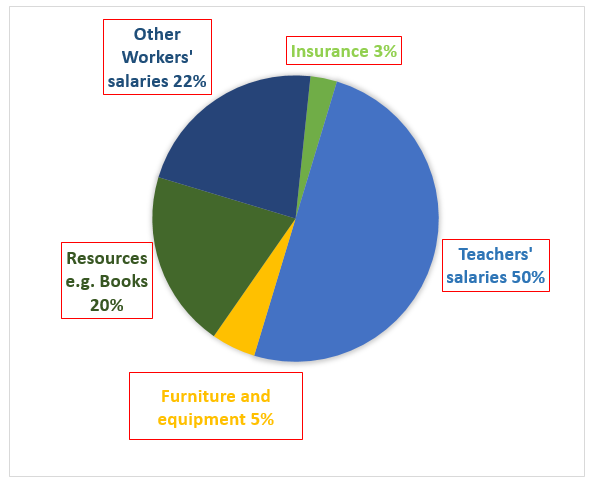
Total School Spending 1991
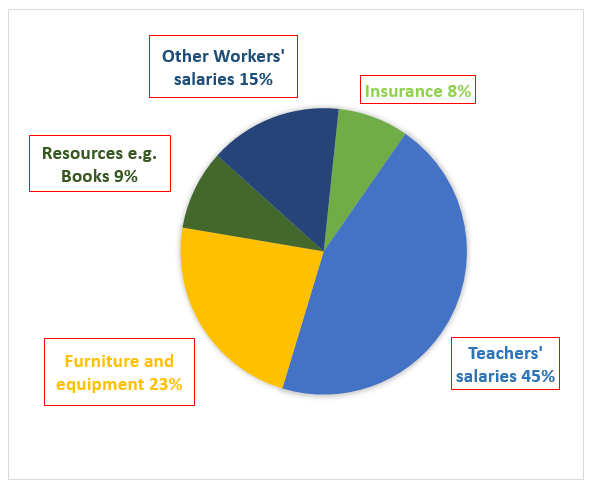
Total School Spending 2001
Sample Answer:
The given pie charts presents data on the annual spending in an UK school in three different years commencing from 1981 with a ten years gap. As is observed from the given data, teachers’ salary formed the highest percentage of expenses in all these three different years.
According to the given information, expenses for teachers’ salaries in 1981 in the given UK school consisted 40% while it was 28% for other school staffs. For resources like books the expense was 15% and insurance expense was the least percentage of cost which was 2%. Furniture and other equipment took 15% costs which was exactly same as it was for resources like books.
After 10 years, teachers’ salary increased by 10% than it was in 1981. Expenses for other workers salary, furniture and other equipment decreased while expense on books increased by 5%. Insurance cost increased only by 1%.
Finally in 2001, Salary for teachers and other workers were 60% in total and insurance cost increased to 8%. The cost for furniture increased significantly (23%) while it decreased for books (9%).