IELTS Writing Task 1

Academic IELTS writing task 1 requires an Academic IELTS test taker to write a summary or a report based on a given graph. There are various types of graphs that you can expect in your Academic IELTS test and this section completely focus on your preparation for graph writing. Each graph question provided here is taken from real IELTS exams and the model answer(s) are helpful to give you an idea how to write a summary or report in your IELTS test.

Changes in the size of West Farm and in the value of the land

Size of West Farm and value of the land per hectare from 1900 to 1990

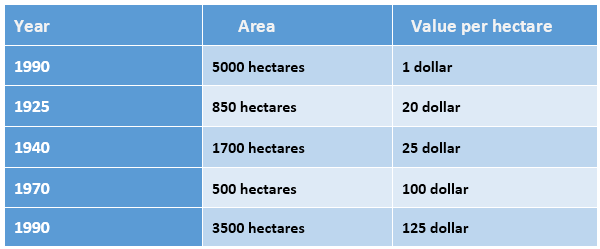
IELTS Academic Writing Task 1 with answer. The table below show the changes in the size of West Farm and in the value of the land per hectare over a period of 90 years from 1900 to 1990. Summarise the…

Journeys made bye different forms of transport in four countries

travel to work by car USA

IELTS Academic Writing Task 1 with answer. You should spend about 20 minutes on this task. The table shows the percentage of journeys made by different forms of transport in four countries. The bar chart shows the results of a…

People’s perception of celebrity news coverage

IELTS Academic Writing Task 1 with answer. You should spend about 20 minutes on this task. The table shows the results of a survey of people’s perception of celebrity news coverage. Summarize the information by selecting and reporting the main…

Numbers of hours devoted to various activities

IELTS Academic Writing Task 1 with answer. The pie chart shows the numbers of hours devoted to various activities in the average working woman’s day. Summarize the information by selecting and reporting the main features, and make comparisons where relevant.…

Impact of vaccinations on the incidence of whooping cough

impact of vaccinations

IELTS Academic Writing Task 1 with answer. The graph shows the impact of vaccinations on the incidence of whooping cough, a childhood illness, between 1940 and 1990 in Britain. Summarize the information by selecting and reporting the main features, and…

The table shows the numbers of visitors to Ashdown Museum

IELTS Academic Writing Task 1 with answer. The table below shows the numbers of visitors to Ashdown Museum during the year before and the year after it was refurbished. The charts show the result of surveys asking visitors how satisfied…

Average carbon dioxide emissions in the UK, Sweden, Italy and Portugal

IELTS Academic Writing Task 1 with answer. The Graph below shows average carbon dioxide (CO2) emissions per person in the United Kindom, Sweden, Italy and Portugal between 1967 and 2007. Summarise the information by selecting and reporting the main features,…

Information about population figures in Japan

IELTS Academic Writing Task 1 with answer. The chart and table below give information about population figures in Japan. Summarize the information by selecting and reporting the main features, and make comparisons where relevant. You should spend about 20 minutes…

3D cinema screens and film releases

IELTS Academic Writing Task 1 with answer. The graph and chart below give information about 3D cinema screens and film releases. Summarize the information by selecting and reporting the main features, and make comparisons where relevant. You should spend about…

Water used for different purposes in six areas of the world

IELTS Academic Writing Task 1 with answer. The charts below show the percentage of water used for different purposes in six areas of the world. Summarise the information by selecting and reporting the main features, and make comparisons where relevant.…