IELTS Academic Writing Task 1 with answer.
You should spend about 20 minutes on this task.
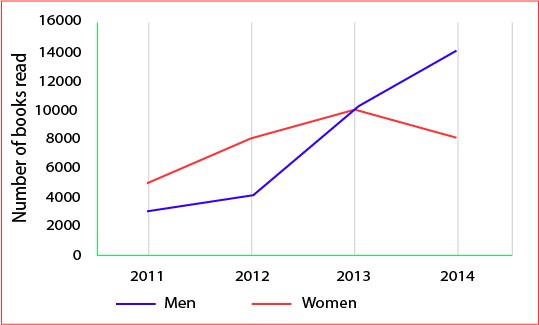
The graph below shows the number of books read by men and women at Burnaby Public Library from 2011 to 2014.
Summarise the information by selecting and reporting the main features, and make comparisons where relevant.
You should write at least 150 words.
Burnaby Public Library
Sample Answer 1:
The diagram illustrates the number of readers by gender at Burnaby Public library for a 4 years’ period. As is observed from the given line graph, men readers’ number increased over time compared to the total women reader in this library though initially more women went to read books there.
According to the given diagram, more than 5 thousand women readers went to Burnaby public library in 2011 compared to the just over 2 thousand male readers in this library. Both the male and female book readers in this library increased in the next year but the growth of women readers was higher than the growth of male readers. In 2013, male readers’ number intersected the female readers and in the next year male readers exceeded the number of female readers in Burnaby library. In 2014, there were about 14 thousand male readers compared to the 7 thousand female readers.
Sample Answer 2:
The presented line graph illustrates amount of books read by gender at Burnaby Public Library between 2011 and 2014.
The overall trend in the graph demonstrates contrasting reading pattern between men and women. Women read about 5000 books in 2011, whereas men read lesser by 2000 books in comparison to women in the same year. Women’s reading habit increased gradually up until 2013 to 10000 books, which is also the peak figure for women. However, after 2013, the trend indicates dramatic drop to 8000 books read in 2014.
Meanwhile, men readers’ rate increased rapidly between 2012 and 2014 by 10000 books; that is a significant jump from 4000 books read in 2012 to 14000 books in 2014. Surprisingly, in 2013 both men and women read same amount of books of 10000 respectively.
Overall, the graph reveals positive improvement in men’s reading habit since 2013, while women’s reading trend shows the opposite.
[fusion_builder_container hundred_percent=”yes” overflow=”visible”][fusion_builder_row][fusion_builder_column type=”1_1″ background_position=”left top” background_color=”” border_size=”” border_color=”” border_style=”solid” spacing=”yes” background_image=”” background_repeat=”no-repeat” padding=”” margin_top=”0px” margin_bottom=”0px” class=”” id=”” animation_type=”” animation_speed=”0.3″ animation_direction=”left” hide_on_mobile=”no” center_content=”no” min_height=”none”][ By – Lalitha] [/fusion_builder_column][/fusion_builder_row][/fusion_builder_container]