IELTS Academic Writing Task 1 with answer.
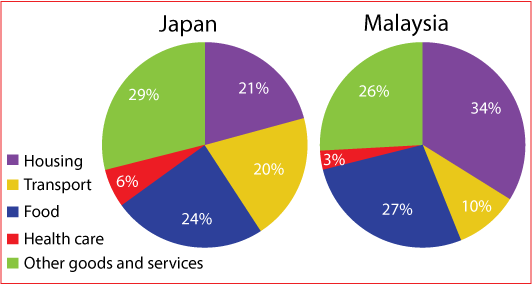
The pie charts below show the average household expenditures in Japan and Malaysia in the year 2010.
Summarise the information by selecting and reporting the main features, and make comparisons where relevant.
You should spend about 20 minutes on this task.
You should write at least 150 words.
Average Household Expenditures by Major Category
IELTS Academic Writing Task 1: Sample Answer
The given pie charts compare the average household expenditure in five major categories in Japan and Malaysia for the year 2010. As is observed, expenditure percentage on housing and food in Malaysia was higher than that of Japan while Japanese population had to spend more percentage of their earning on healthcare and transport than that of Malay people.
According to the diagram, Malay people spent 34% on an average for housing which was the largest percentage of their expenditure among the given five categories. They had to spend 27% on foods and almost same percentage on other goods and services. Expenditure on healthcare was only 3% which comprised the lowest percentage of their expenditure. 10% of their expenditure was on transport.
On the other hand, Japanese people spent more percentage of their money on different goods and services while their second largest expenditure was for food (24%). They spent 6% on health care which was the least percentage of their expenditure. On an average 20% of their expenditure went on transportation and finally 21% for housing.
In summary, transportation and healthcare expenditures by Japanese citizen were higher than Malay citizens’ expenditure while food and housing expenditure were lower in percentages.