IELTS Academic Writing Task 1 with answer.
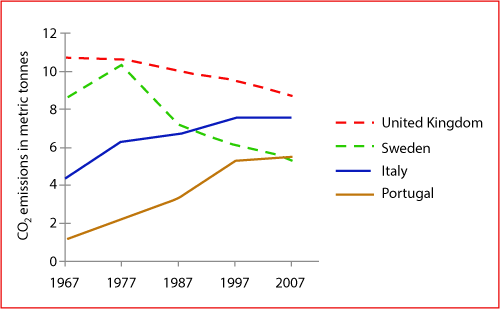
The Graph below shows average carbon dioxide (CO2) emissions per person in the United Kindom, Sweden, Italy and Portugal between 1967 and 2007.
Summarise the information by selecting and reporting the main features, and make comparisons where relevant.
You should spend about 20 minutes on this task.
You should write at least 150 words.
Average carbon dioxide (CO2) emissions per person, 1967-2007
IELTS Academic Writing Task 1: Sample Answer
The given line graph compares the average carbon dioxide (CO2) emission per person in four different countries over a 40 years period commencing from 1967. As is seen in the given illustration, average CO2 emission in the UK and Sweden dropped over the period and it increased in Italy and Portugal.
According to the given line graph, each person in the United Kingdom omitted about 11 metric tonnes of CO2 in 1967 and this was higher than the average CO2 emission per person in Sweden, Italy and Portugal. Over the period the emission decreased in the UK and reached around 9 metric tonnes in 2007 which was still the highest amount among the given four countries. Per person, CO2 emission in Sweden was just above 8 t (metric tonnes) in 1967 and it increased till 1977 when it reached above 10 mt. Afterwards, this amount sharply decreased and dropped to below 6 t in 2007. On the contrary, in 1967 Italy and Portugal were the least CO2 producing countries on average for each citizen, just above 4 and 1.5 t respectively. The emission in these two countries kept on increasing and both had more average emission than that of Sweden. Per person, CO2 emission in Sweden was second highest in the early state but they managed to decrease that over time.
More useful resources are just a click away.
See some IELTS Line graph Answers